Tools
NOR.06 · Norte ES
See it live

TDI / NOR.06 · activates · The command center for your brands

Norte

All your social channels in one place: what you spent, what you sold, and how people feel about you.

A command center per brand with nineteen views: objective, sales, occupancy, summary, campaigns, channels, funnel, placements and QRs, listening, responses, tasks, trafficker, insights, recommendations, guardrails, log, demographics, sources and settings. It works toward a business goal, not toward spend. By brand and by country, or every country together, measured against the same yardstick: every decision made in one place. It feeds itself: it ingests every hour, with no computer turned on.

Digital media
Google Search and Display, YouTube, Meta, TikTok, Spotify
Offline media
billboards, bus shelters and press, tracked with a dynamic QR code and coupon — whatever can be tracked, and the dashboard says how much that is
Listening
seven platforms, with sentiment and topics
Replies
every comment arrives with a proposed reply, or flagged to escalate to a person; nothing goes out without your approval
Real sales
cross-checked against spend: cost per unit sold, not per click
Tests
3,046 automated, running without a safety net

Who it's for, and what question they bring
CMO«is it working toward the goal?»
The goal is recalculated from four business inputs —capacity, occupancy, showtimes, ticket price— not hand-typed. And the dashboard shows progress against that goal, not against spend.
Trafficker / media«what do I move tomorrow?»
The recommendation, written in plain language, with its estimated impact in pesos and the list of guardrails already checked. Zero campaigns activate themselves: create = paused, activate = manual only.
Sales«where did that sale come from?»
Real sales cross-checked against spend, channel by channel. In one demo run, the channel the platform called best was the worst on real cost per ticket.
General management«who moved my budget?»
The log: actor, verb, destination, time and result. Nothing moves in a media account without leaving that line behind.
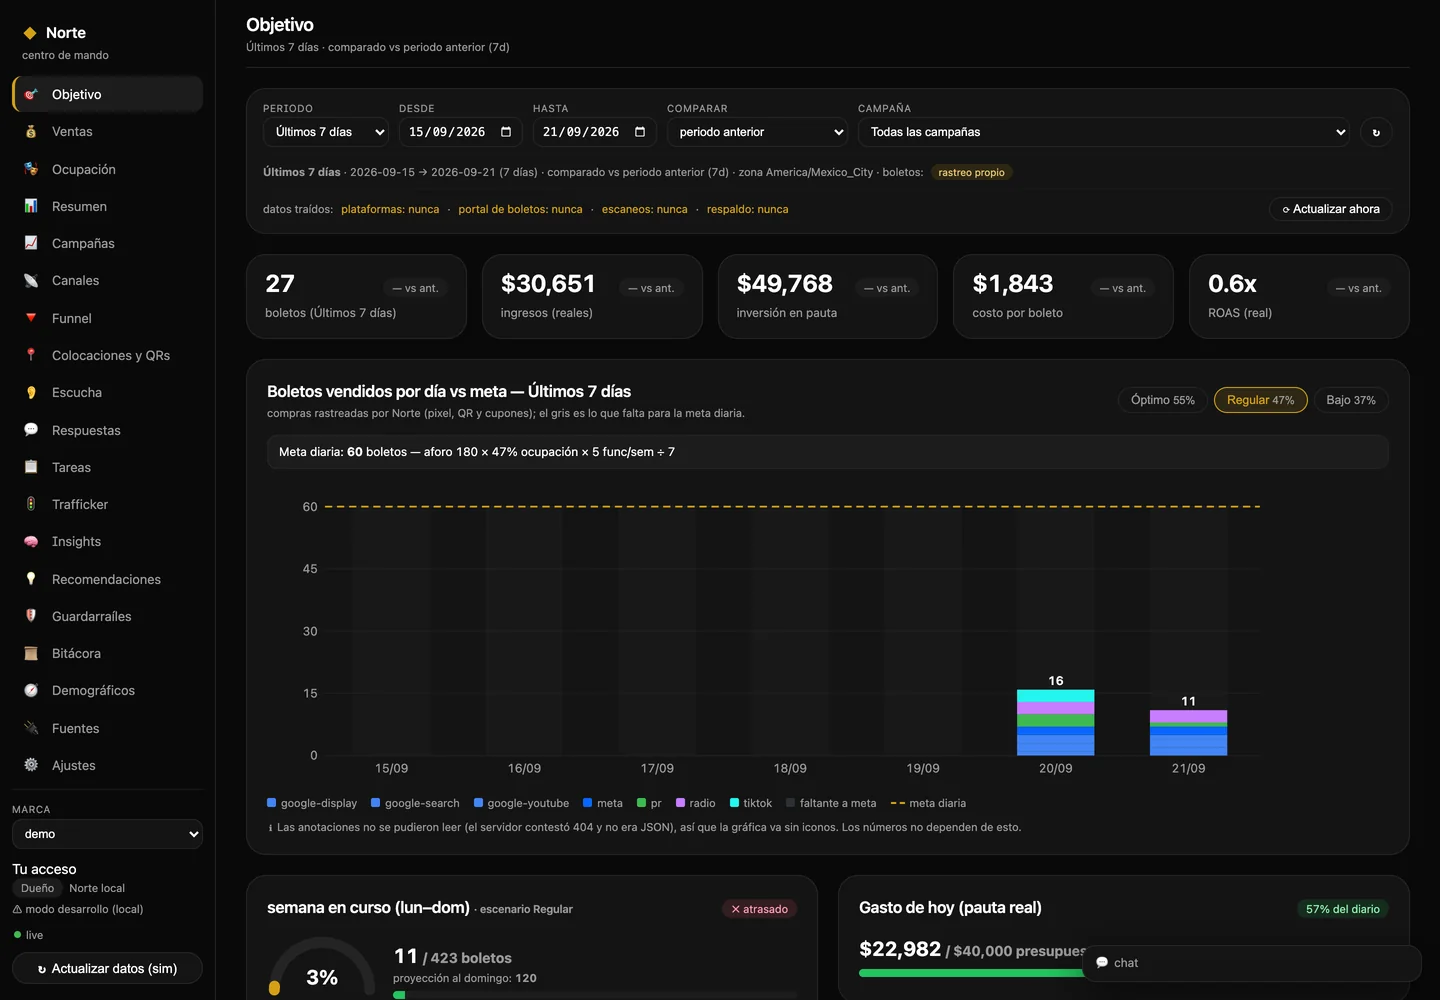
Norte's Objective screen: tickets, revenue, spend, cost per ticket and ROAS for the last seven days; the daily chart against the goal, and today's spend against budget.
AObjective — the screen the day opens with. The five numbers that matter, from the last seven days: 27 tickets, $30,651 in real revenue, $49,768 in spend, $1,843 cost per ticket and a 0.6× ROAS. Yes, 0.6: the dashboard doesn't dress it up. Below, daily sales against the goal, stacked by channel. And notice where the goal comes from —«60 tickets — capacity 180 × 47% occupancy × 5 showtimes a week ÷ 7»— with its three scenarios one click away: optimistic 55%, average 47%, low 37%. No goal is hand-typed into the code: it's recalculated from those four inputs, which the client updates as their season changes.
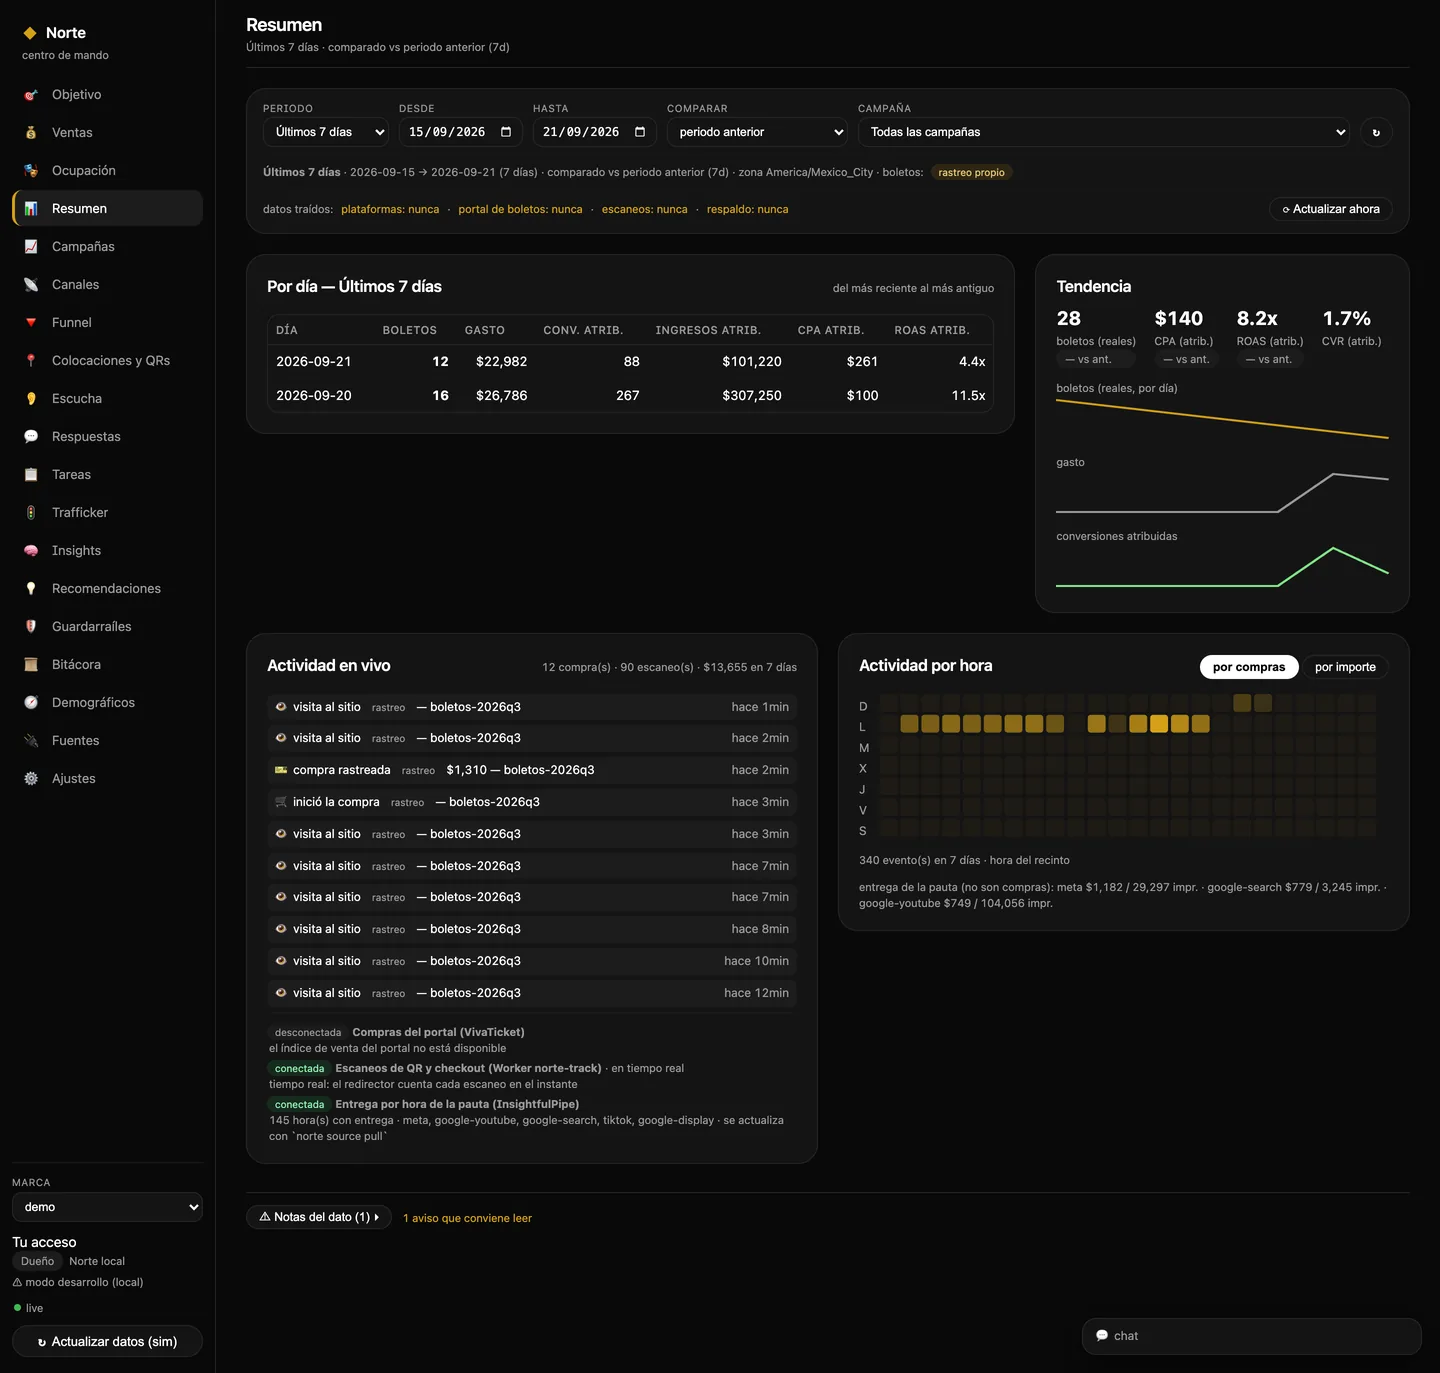
Summary screen: a day-by-day table with tickets, spend, attributed conversions, revenue, CPA and ROAS; a trend panel; and a live activity feed with visits, purchases and scans minute by minute.
BSummary — yesterday, and what's happening right now. At the top, one row per day: September 21 had 12 tickets with $22,982 in spend and a 4.4× ROAS; the 20th, 16 tickets with $26,786 and 11.5×. Next to it, the week's trend: 28 real tickets, $140 CPA, 8.2× ROAS, 1.7% conversion. And below, live activity: 12 purchases, 90 scans and $13,655 over seven days, with the time of every visit, every purchase started and every purchase closed. A director can see the pulse without asking anyone for anything.
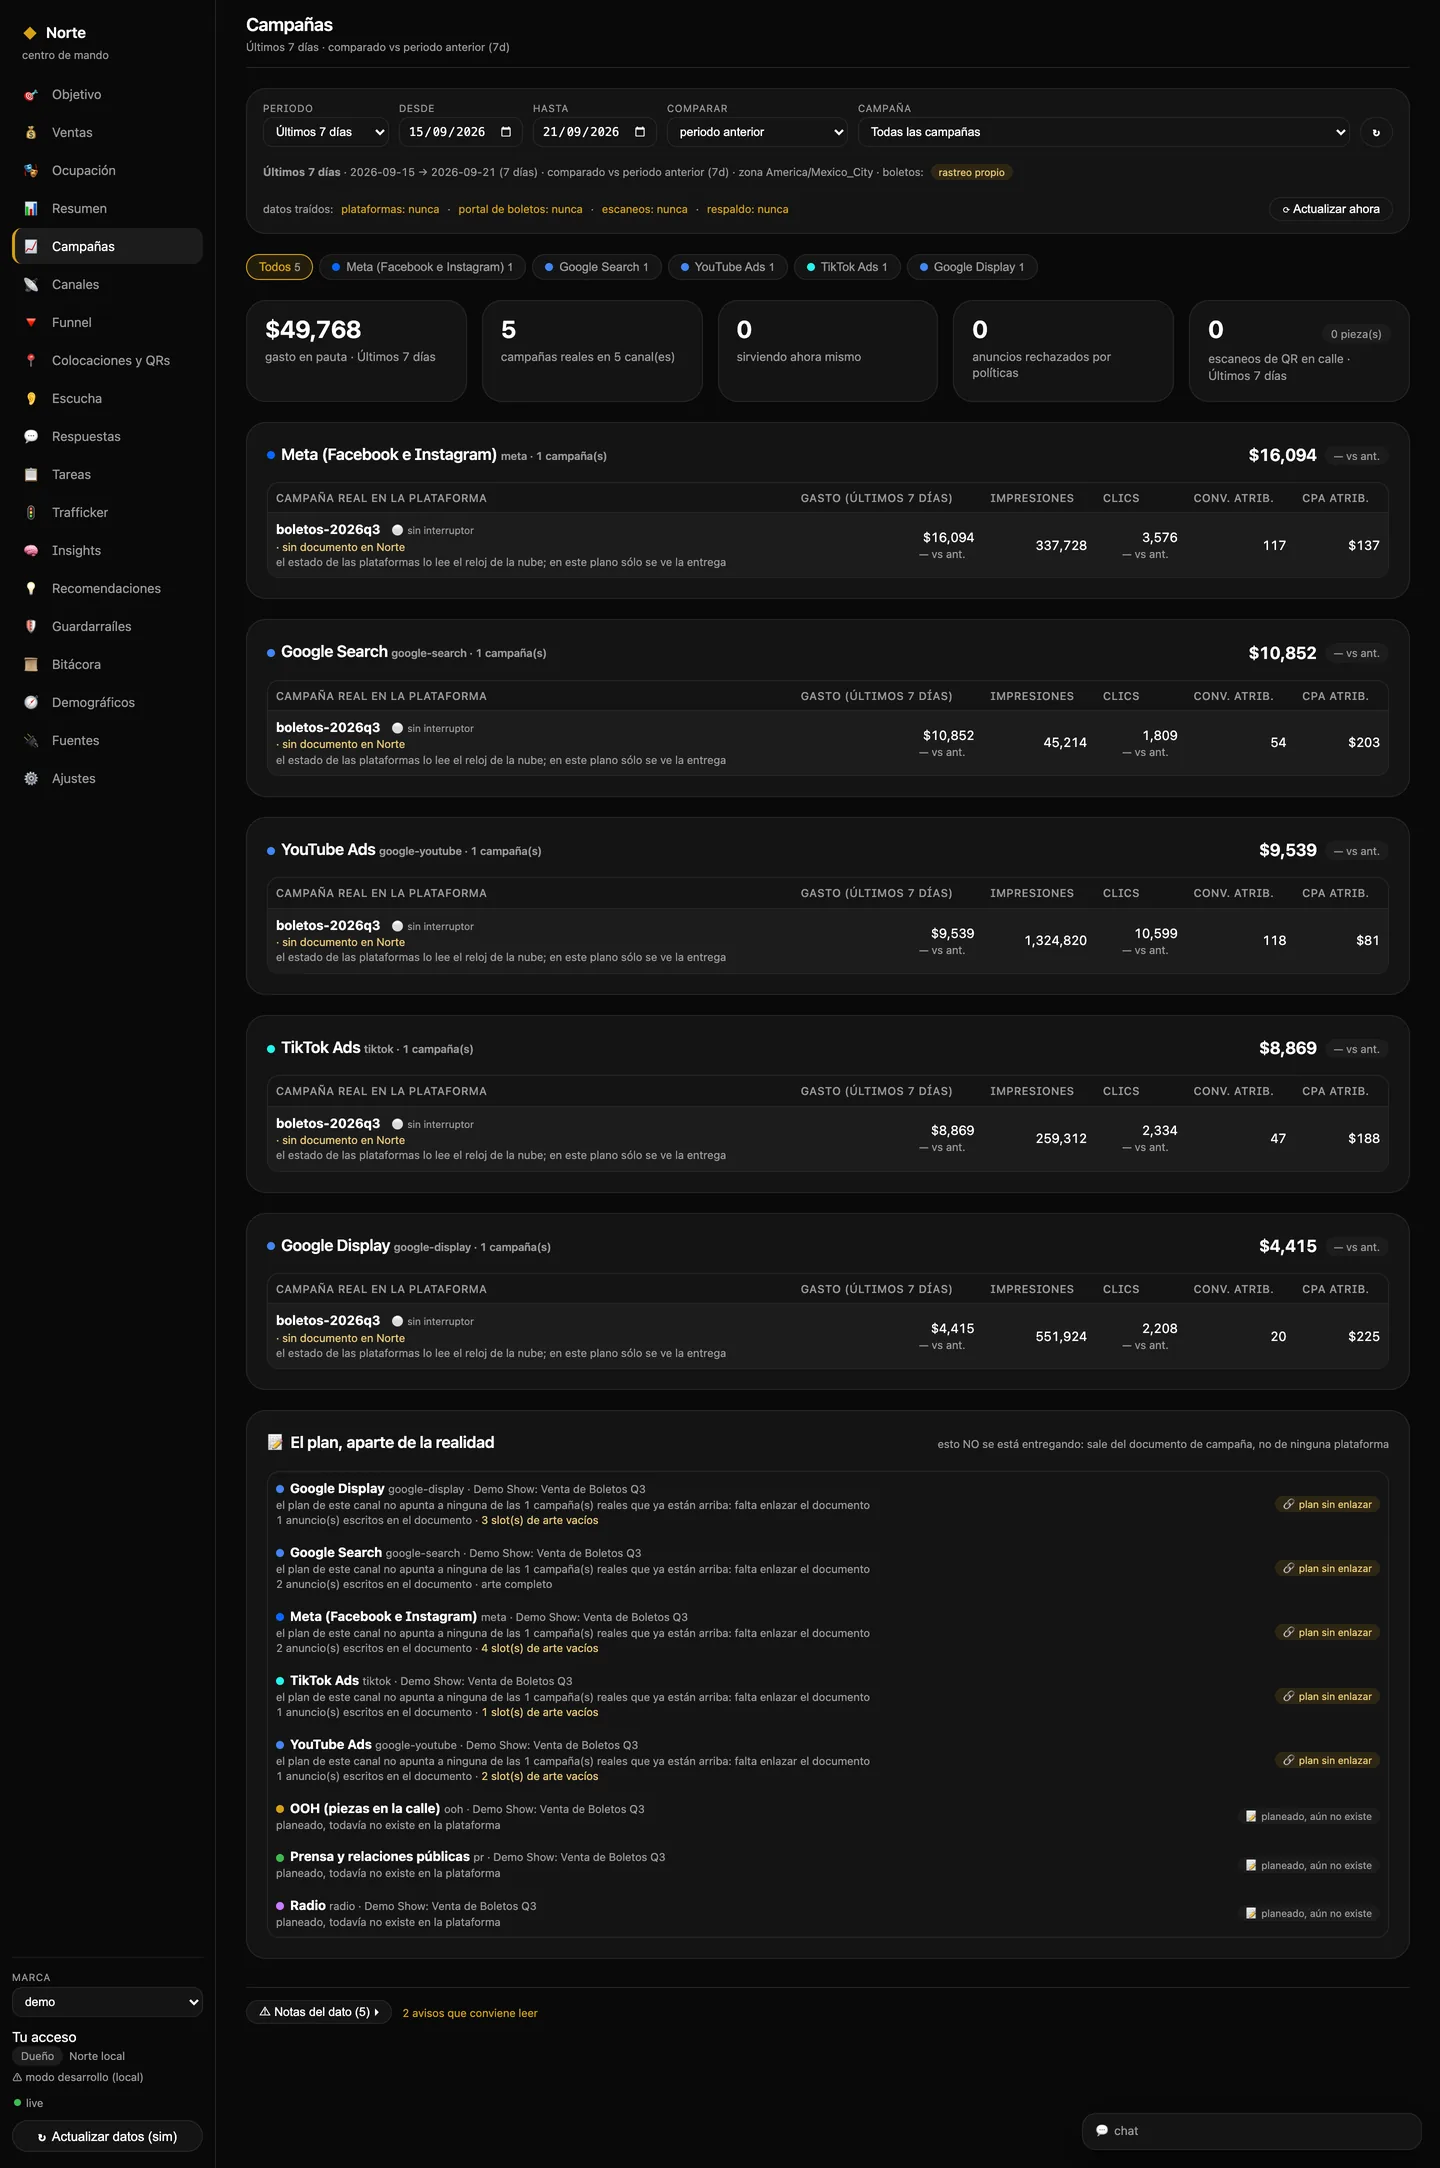
Campaigns screen: five real campaigns grouped by platform — Meta, Google Search, YouTube, TikTok and Google Display — each with spend, impressions, clicks, attributed conversions and CPA.
CCampaigns — what's actually running on each platform. Not what someone typed into a spreadsheet: the five campaigns that exist in the accounts, read straight from the API and grouped by channel — Meta $16,094, Google Search $10,852, YouTube $9,539, TikTok $8,869 and Google Display. And when a platform campaign has no matching document in Norte, it says so outright: «no switch · no document in Norte». That's the difference between a dashboard and a report.
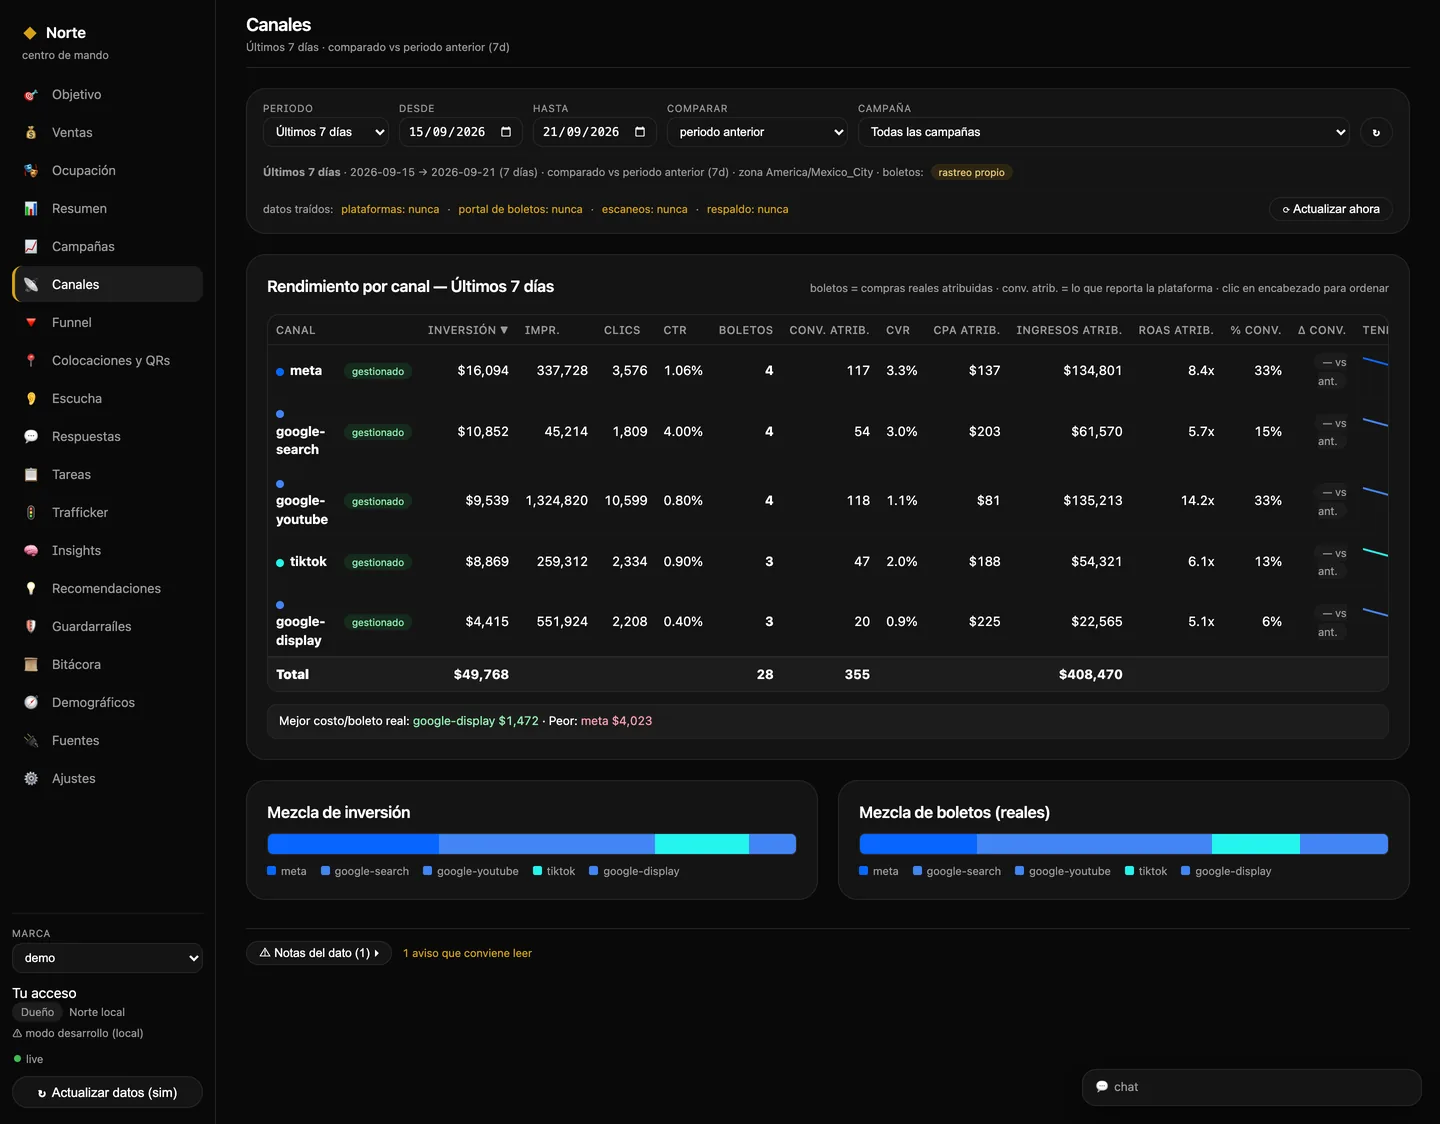
Channels screen: a comparison table of the five channels with spend, impressions, clicks, CTR, real tickets, attributed conversions, CPA, revenue and ROAS; below, the spend mix against the ticket mix.
DChannels — and this is where more than one meeting falls apart. The table carries two columns that almost never agree: the real tickets and the conversions the platform reports. Total: $49,768 invested, 28 real tickets and 355 attributed conversions. At the bottom, the line that settles it: «best real cost per ticket: google-display $1,472 · worst: meta $4,023» — while the platform says Meta is the best channel, with an 8.4× ROAS. And the two bars below compare the money mix against the ticket mix: if they don't match, the money is misallocated.
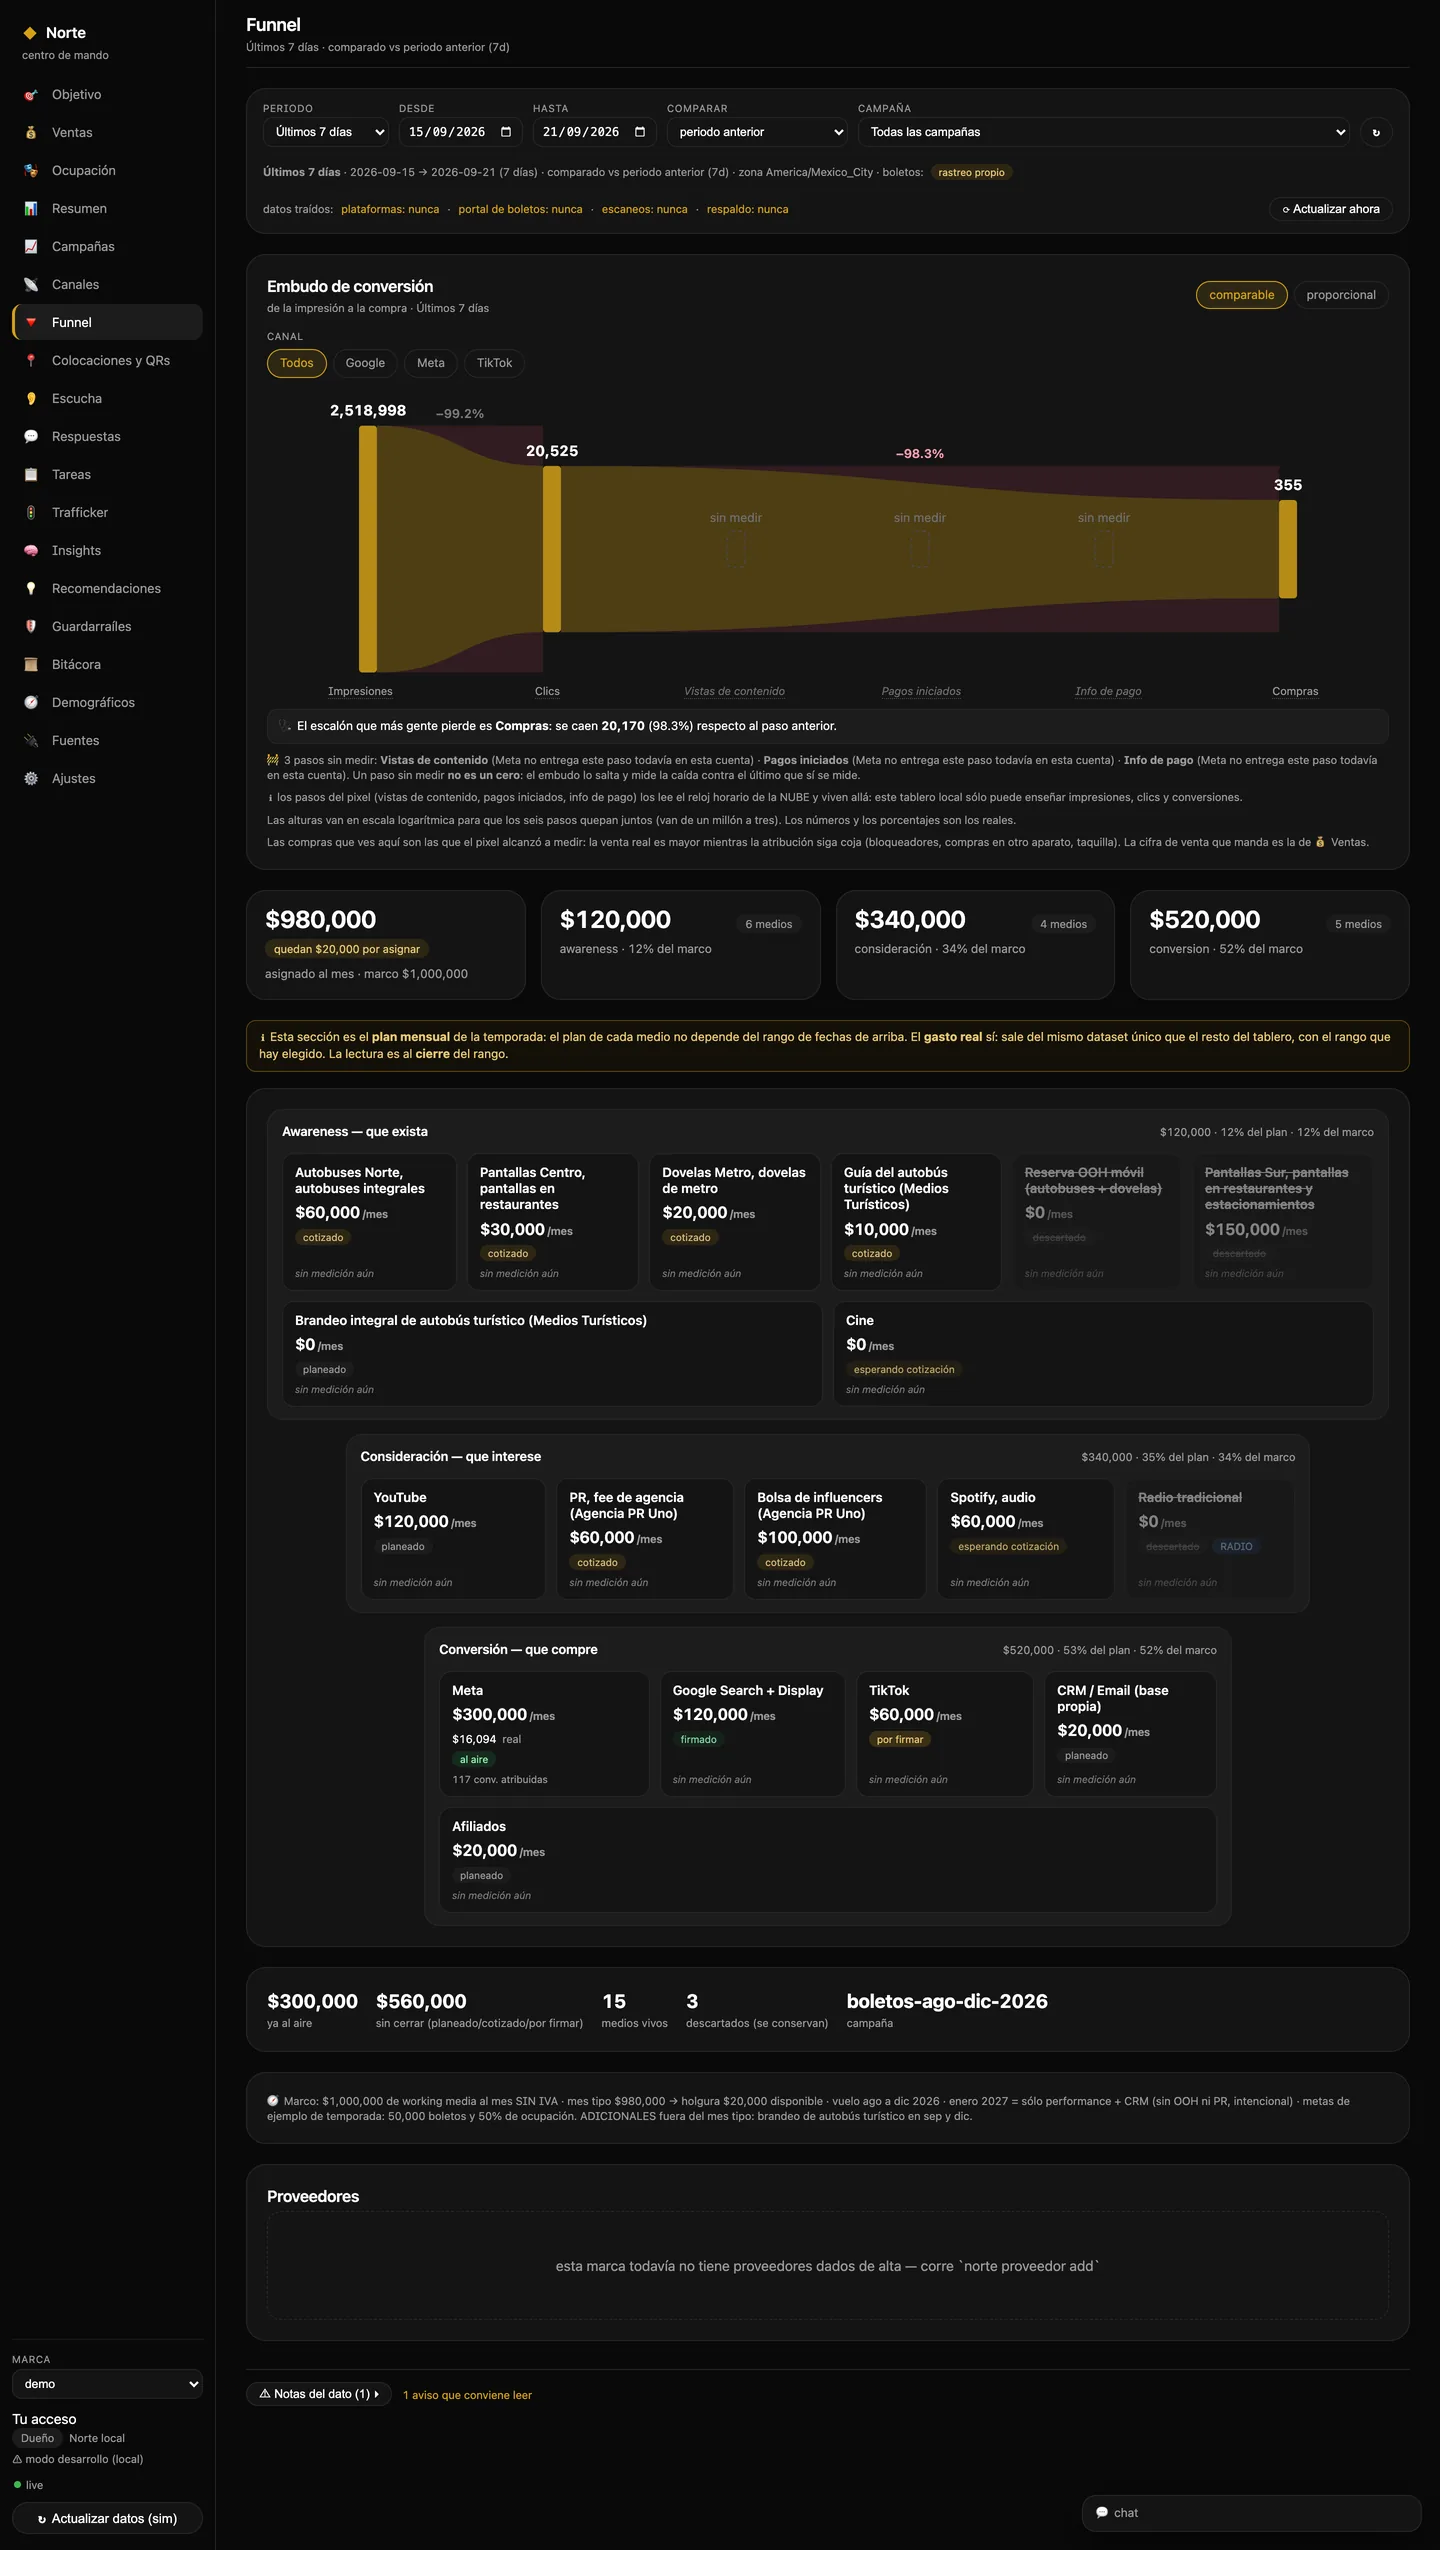
Funnel screen: a six-step funnel from impression to purchase, with three steps marked as unmeasured; below, the monthly plan split across awareness, consideration and conversion.
EFunnel — with the gaps marked, not papered over. From 2,518,998 impressions to 20,525 clicks to 355 purchases, with a diagnosis the system writes on its own: «the step that loses the most people is Purchases: 20,170 drop off (98.3%)». Three funnel steps come back marked «unmeasured» because Meta doesn't deliver them on that account —and the dashboard warns that an unmeasured step is not a zero: it skips the gap and measures against the last step that does exist. Below, the season's plan: $980,000 allocated out of a $1,000,000 budget, split into awareness 12%, consideration 34% and conversion 52%.
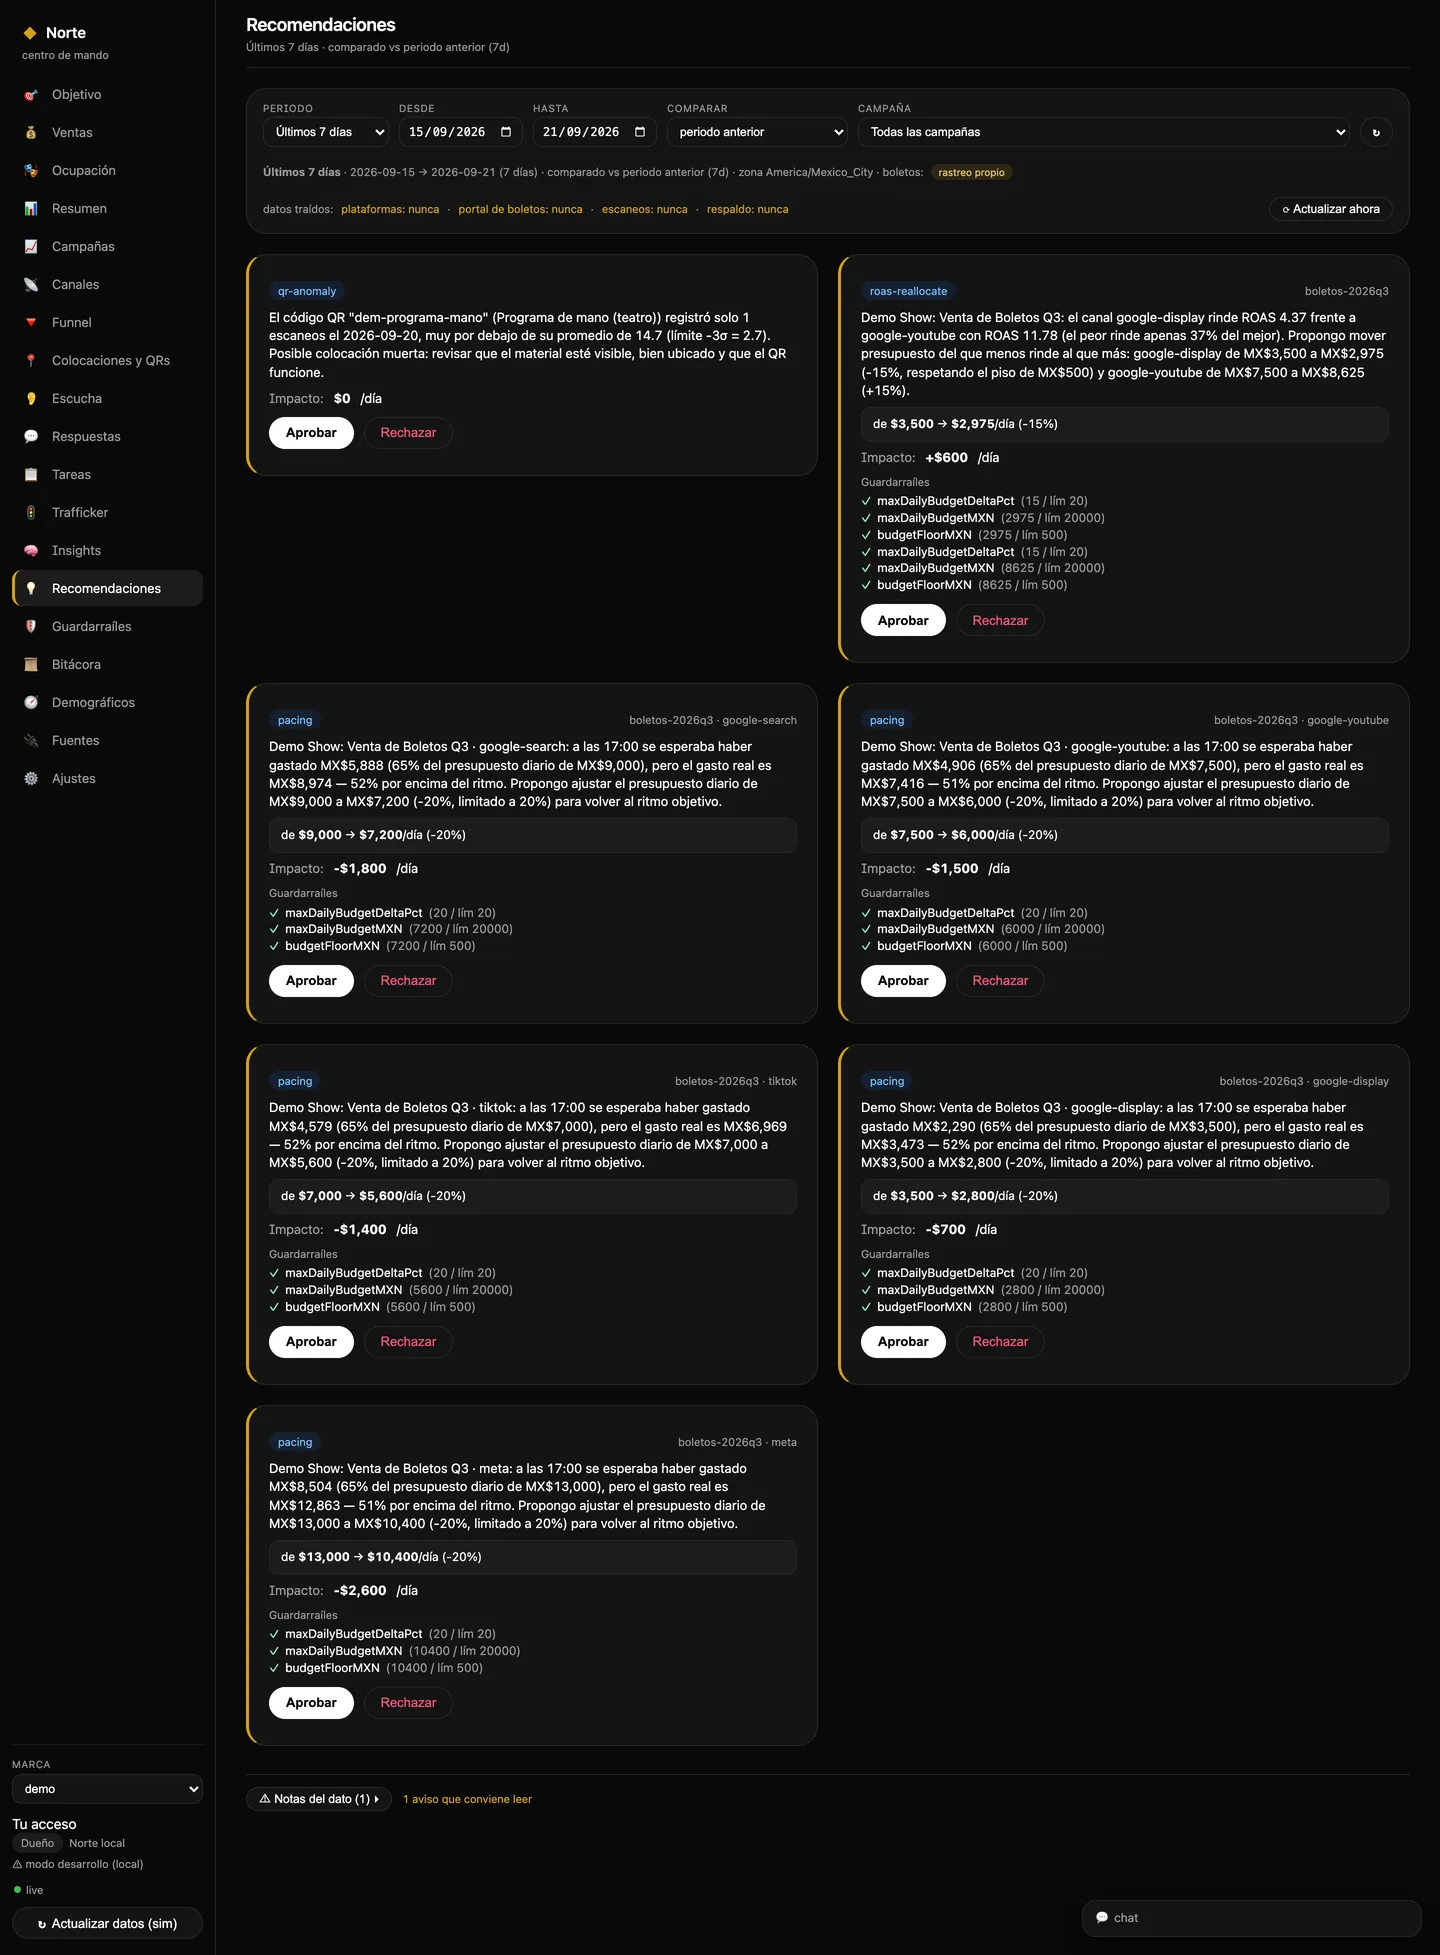
Recommendations screen: cards with the recommendation written in plain language, its impact in pesos per day, the list of checked guardrails and Approve or Reject buttons.
FRecommendations — the dashboard's core. The system writes out, in plain language, what it recommends and why: «google-display delivers a ROAS of 4.37 against google-youtube's 11.78; I propose moving google-display from $3,500 to $2,975 and google-youtube from $7,500 to $8,625». Another flags that at 5:00 PM Google Search was already running 52% over pace and proposes cutting it 20%. Another: a house-program QR code logged 1 scan against an average of 14.7 —«possibly a dead placement». Every card carries its estimated impact in pesos per day (+$600, −$1,800) and the list of guardrails already checked one by one, with their limits. A person decides; the system never does.
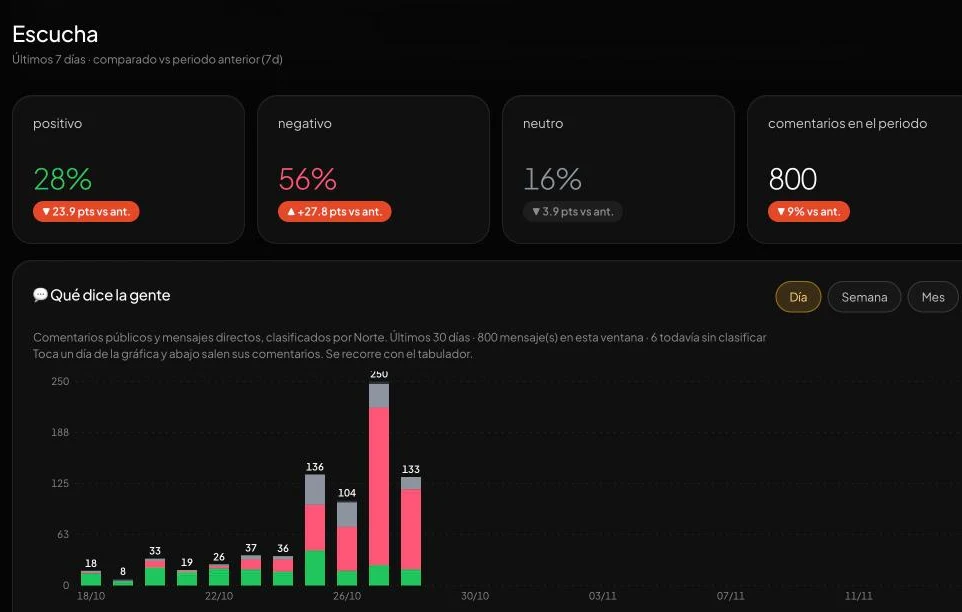
Norte Listening screen: share of positive, negative and neutral comments for the week, total comments, and a daily chart of what people say, stacked by sentiment.
GListening — how people feel about your brand, day by day. Public comments and direct messages from your channels, classified by Norte as positive, negative or neutral. This week: 800 comments and 56% negative, 27.8 points more than the week before. The chart shows the exact day it spiked: 250 comments, almost all in red. Tap a day and its comments appear below. In this screenshot, the brand name and the users are hidden.
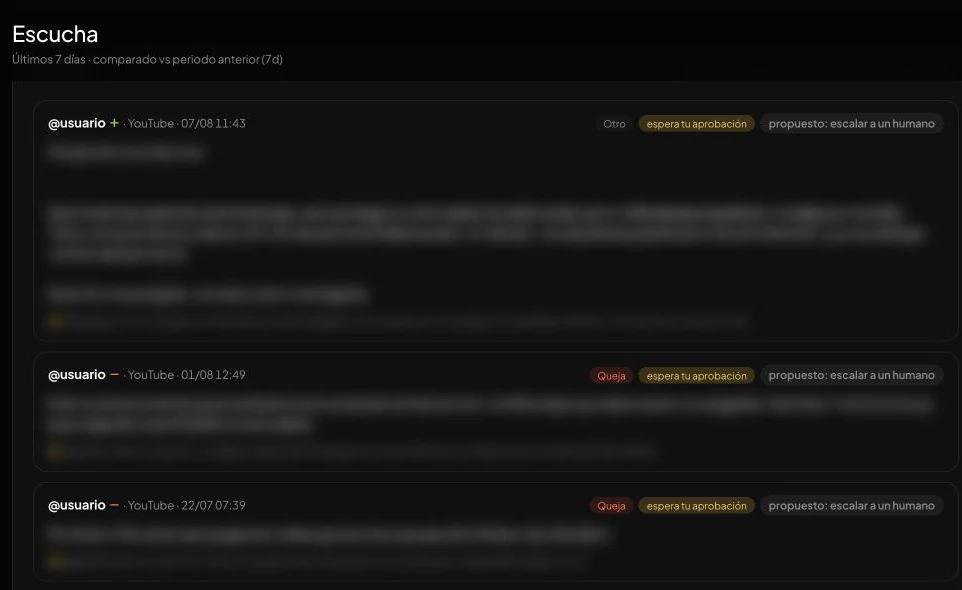
Norte comments screen: each comment with its channel, date, label, the proposed reply and the “awaiting your approval” tag. Users and text blurred.
HReplies — every comment arrives with a proposal. Norte labels it (here, “Complaint” or “Other”) and proposes what to do: a written reply or, when the case shouldn’t get a template answer, “escalate to a human”. Everything stays “awaiting your approval”: Norte never posts on its own. A person reads, approves and replies. The text is blurred on purpose.
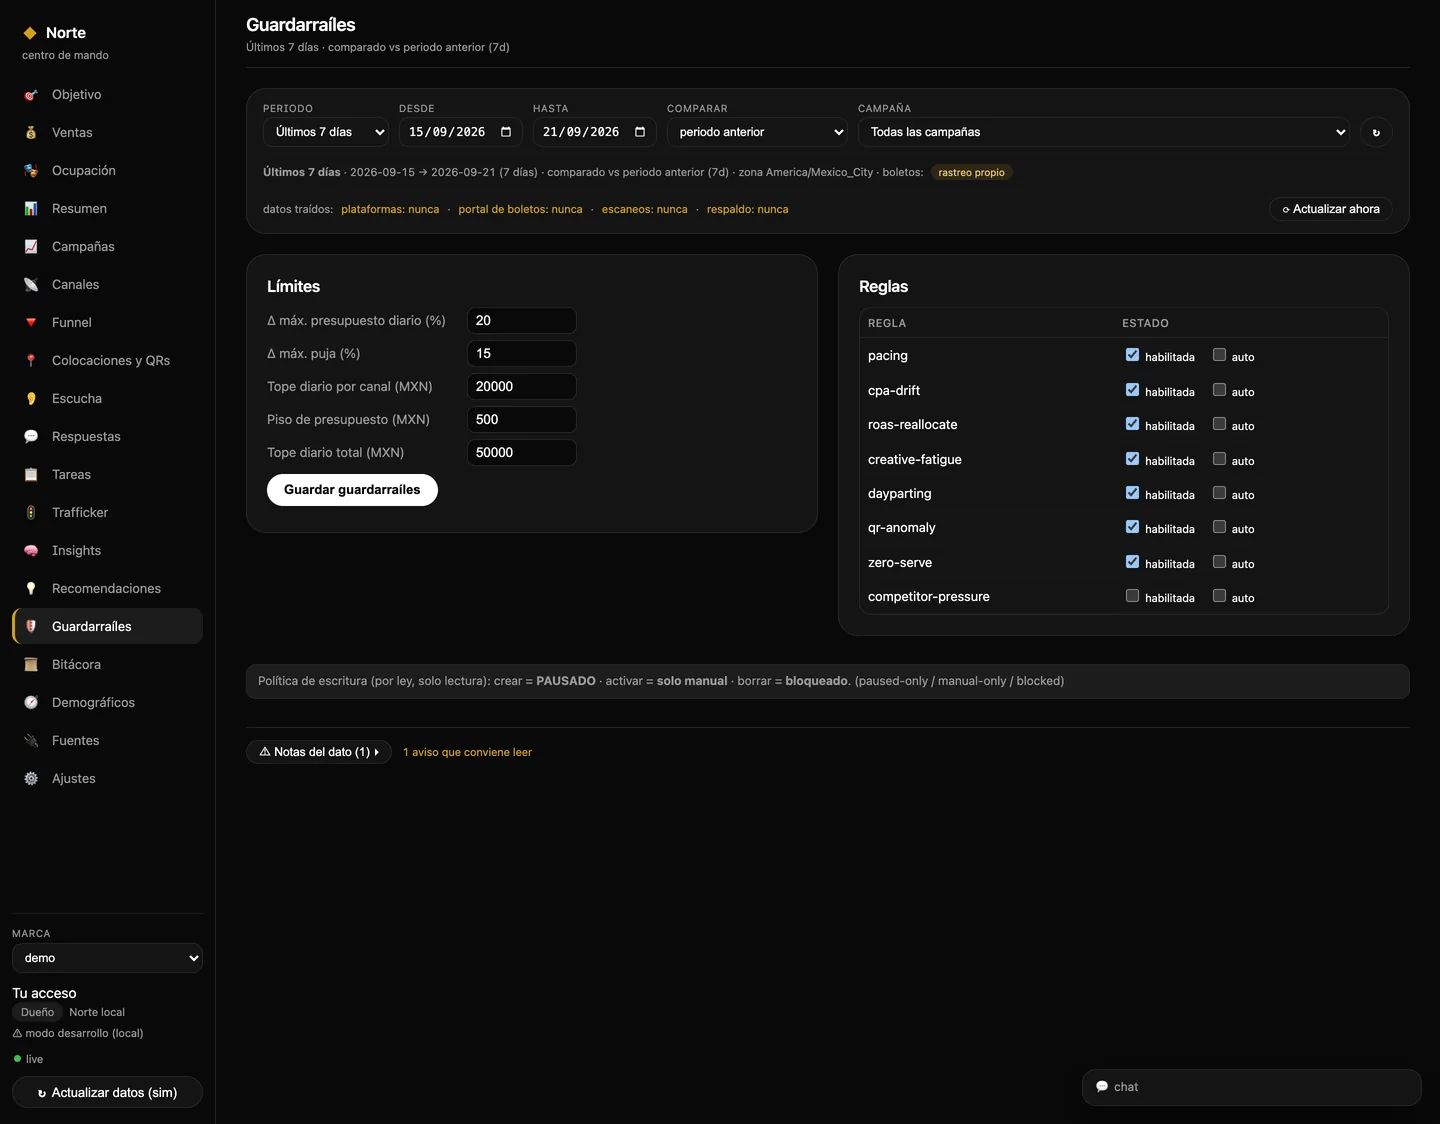
Guardrails screen: budget and bid limits, eight automated rules each with its own switch, and the write policy at the bottom, read-only.
IGuardrails — the brakes, out in the open. A daily cap per channel, a budget floor, a maximum delta for budget and bid, and eight rules each with its own switch: pacing, CPA drift, ROAS-based reallocation, creative fatigue, dayparting, QR anomaly, zero delivery and competitor pressure. At the bottom, written into the system and read-only: «create = PAUSED · activate = manual only · delete = blocked».
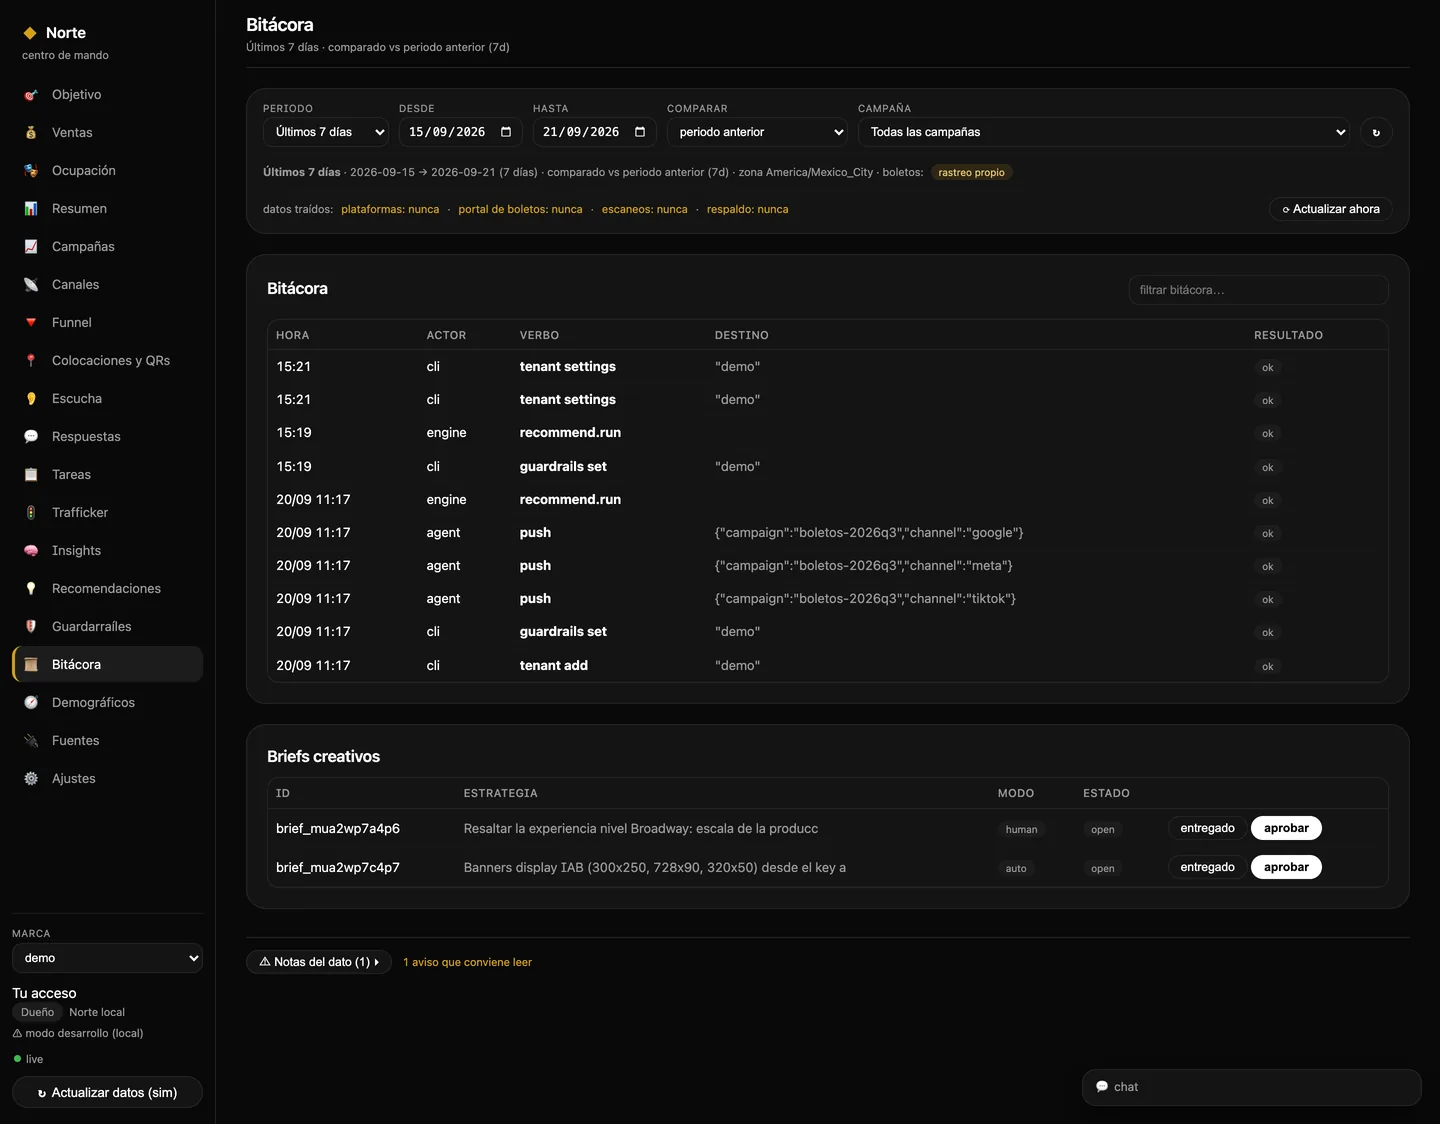
Log screen: a record of time, actor, verb, destination and result for every system action; below, the table of creative briefs with their strategy, mode and status.
JLog — who did what, at what time and with what result. Every line shows the actor (the terminal, the engine, the agent), the verb and the destination: «agent · push · {campaign: boletos-2026q3, channel: meta} · ok». Nothing moves in a media account without leaving this line behind. Below, the creative briefs with their strategy, whether a person or the system wrote them, and what status they're in. It's the document you show an auditor — or a client asking who touched their budget.
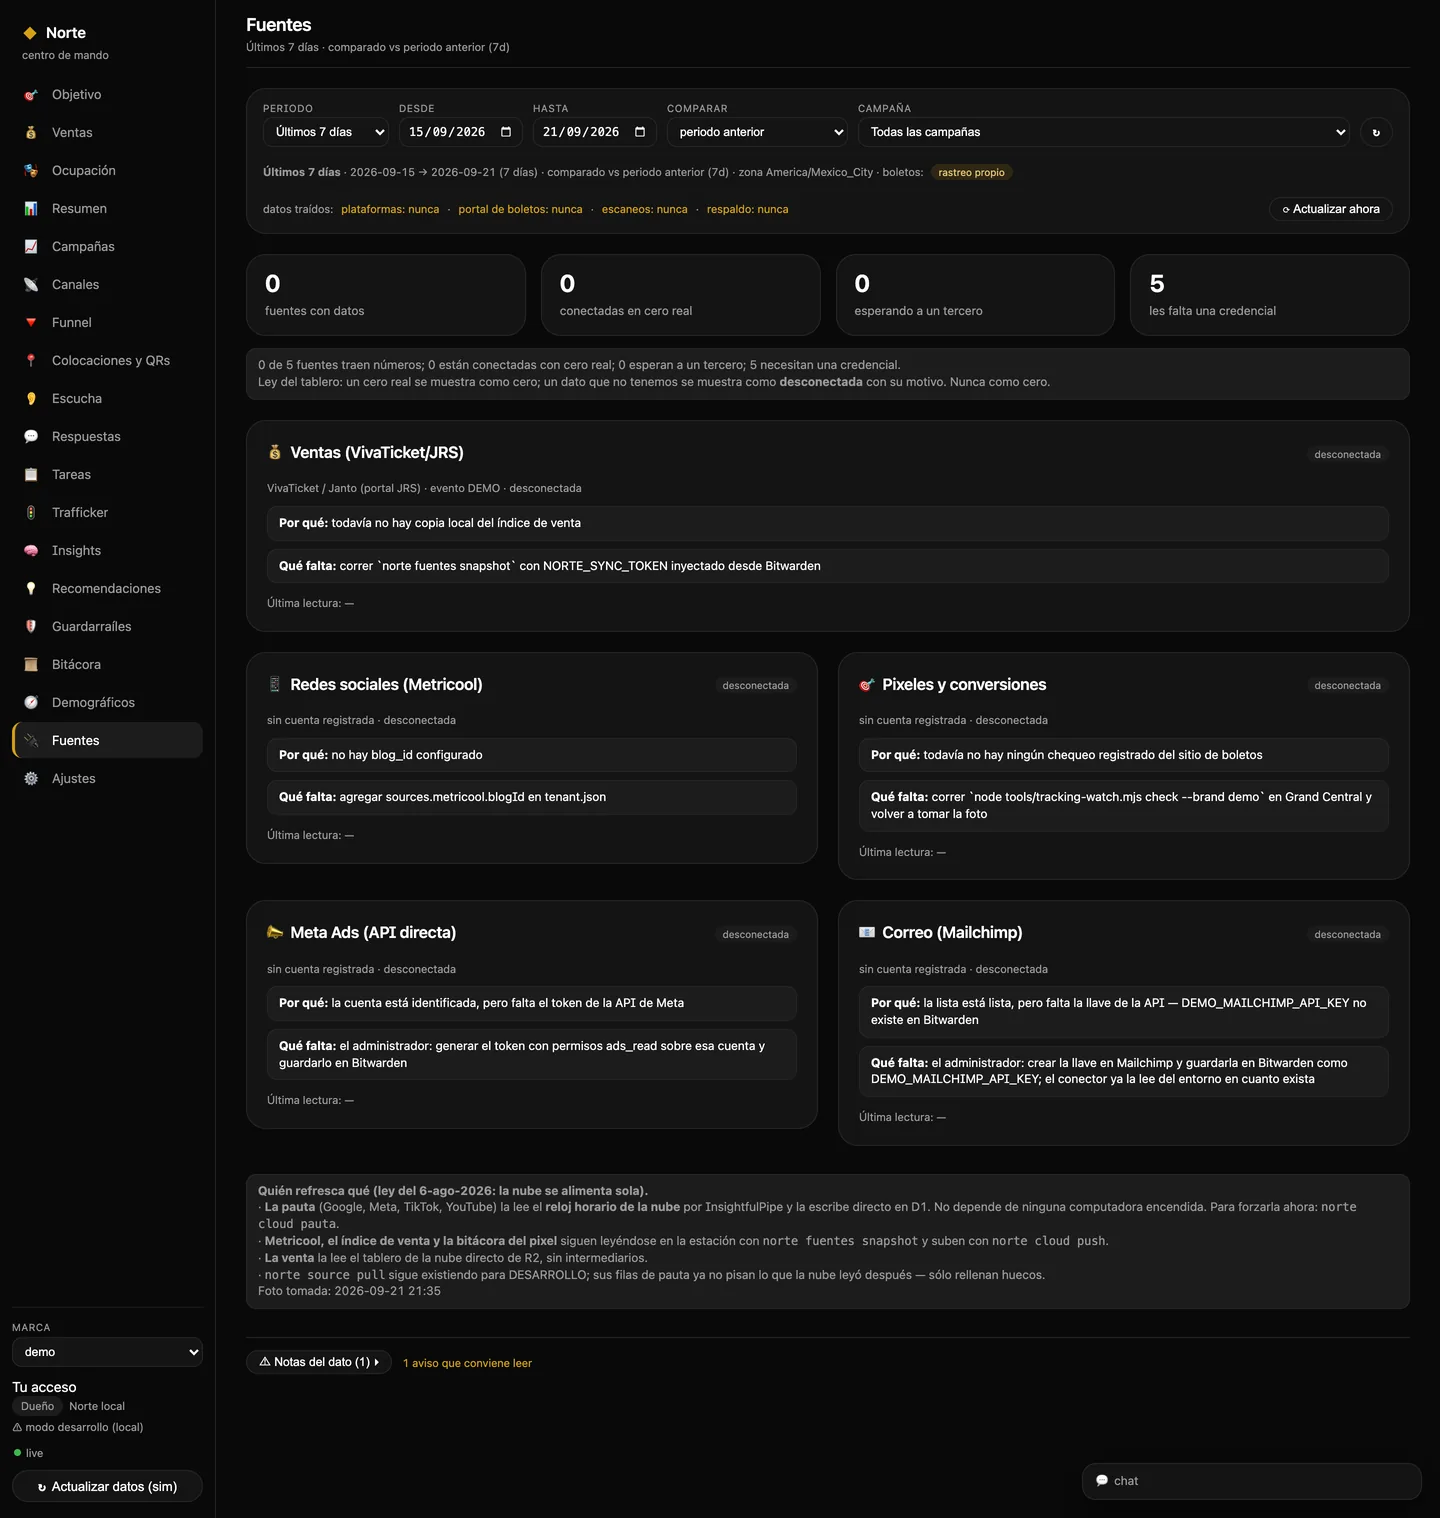
Sources screen: five sources marked as disconnected, each with its reason and what's missing to connect it.
KSources — and here's the house rule. Every source says whether it's carrying data and, if not, why and what's needed to connect it. Printed right on the screen: «a real zero shows as zero; data we don't have shows as disconnected, with its reason. Never as zero.» In this capture all five are disconnected because it's the demo brand — and that's exactly what it looks like when something is missing.

A dashboard that shows zero when it means «I don't know» isn't a dashboard. It's a trap.

And if you already have something ready

Send me the campaign you're about to pay for.

Before the market tells you whether it worked —once it's already charged you for the mistake— we tell you. And if we have no way to measure your category, we tell you that too, no quote required.